Introduction
I bought a set of these Vorblade vortex generator to test on my ProMaster van to see if they could achieve a significant improvement in fuel economy. The idea is that they generate vorticies that lessen the turbulence and separation that occurs at the back of the van and is responsible for a large fraction of the total drag of the van. This page goes over how the Vortex Generators (VGs) were tested and what the results were.
This is kind of long, so I’ll just give the bottom line here for folks who don’t want all the details.
The Vorblade vortex generators had very little if any effect on MPG.
You can judge for yourself by reading the details below, but I think that the test method was good enough to detect a plus or minus 0.5 mpg change in MPG, so any change is probably less than 2.5%. Details for all of the MPG test runs are at the end of this post.
I’ve decided not to permanently install them on my van.
I’m describing the test procedure in quite a bit of detail below – if you have any suggestions for improvements, please let me know.
There is also an alternate test procedure described at the end that is much less time consuming than what I did and (I think) may be just as or more accurate. It is simple enough that interested people could do tests on various MPG mysteries of the PM and report the data back here? Feedback on the new procedure would be appreciated.
Vorblade Setup:
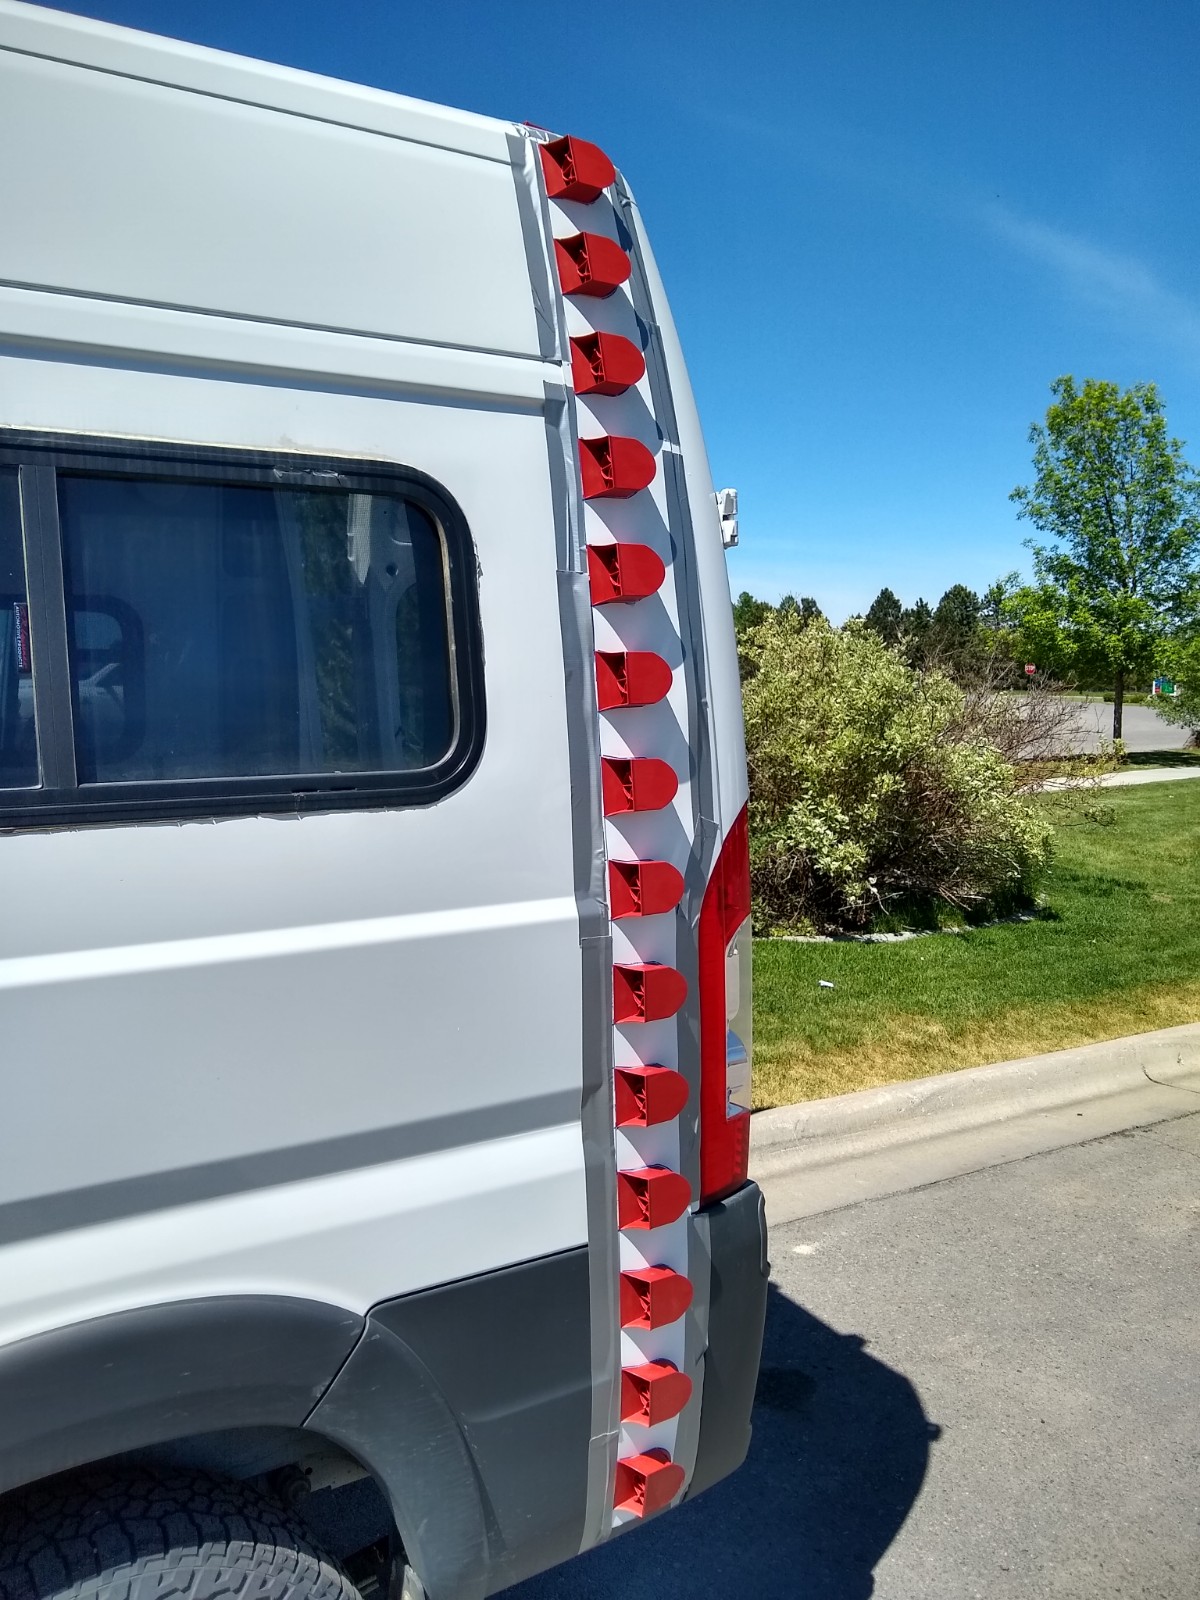
The Vorblades are mostly used on semi trailers, but I followed their instructions on spacing between Vorblades and fore and aft spacing from the back end of the PM. I installed on one set on each side near the back and another set across the roof at the same spacing from the back.
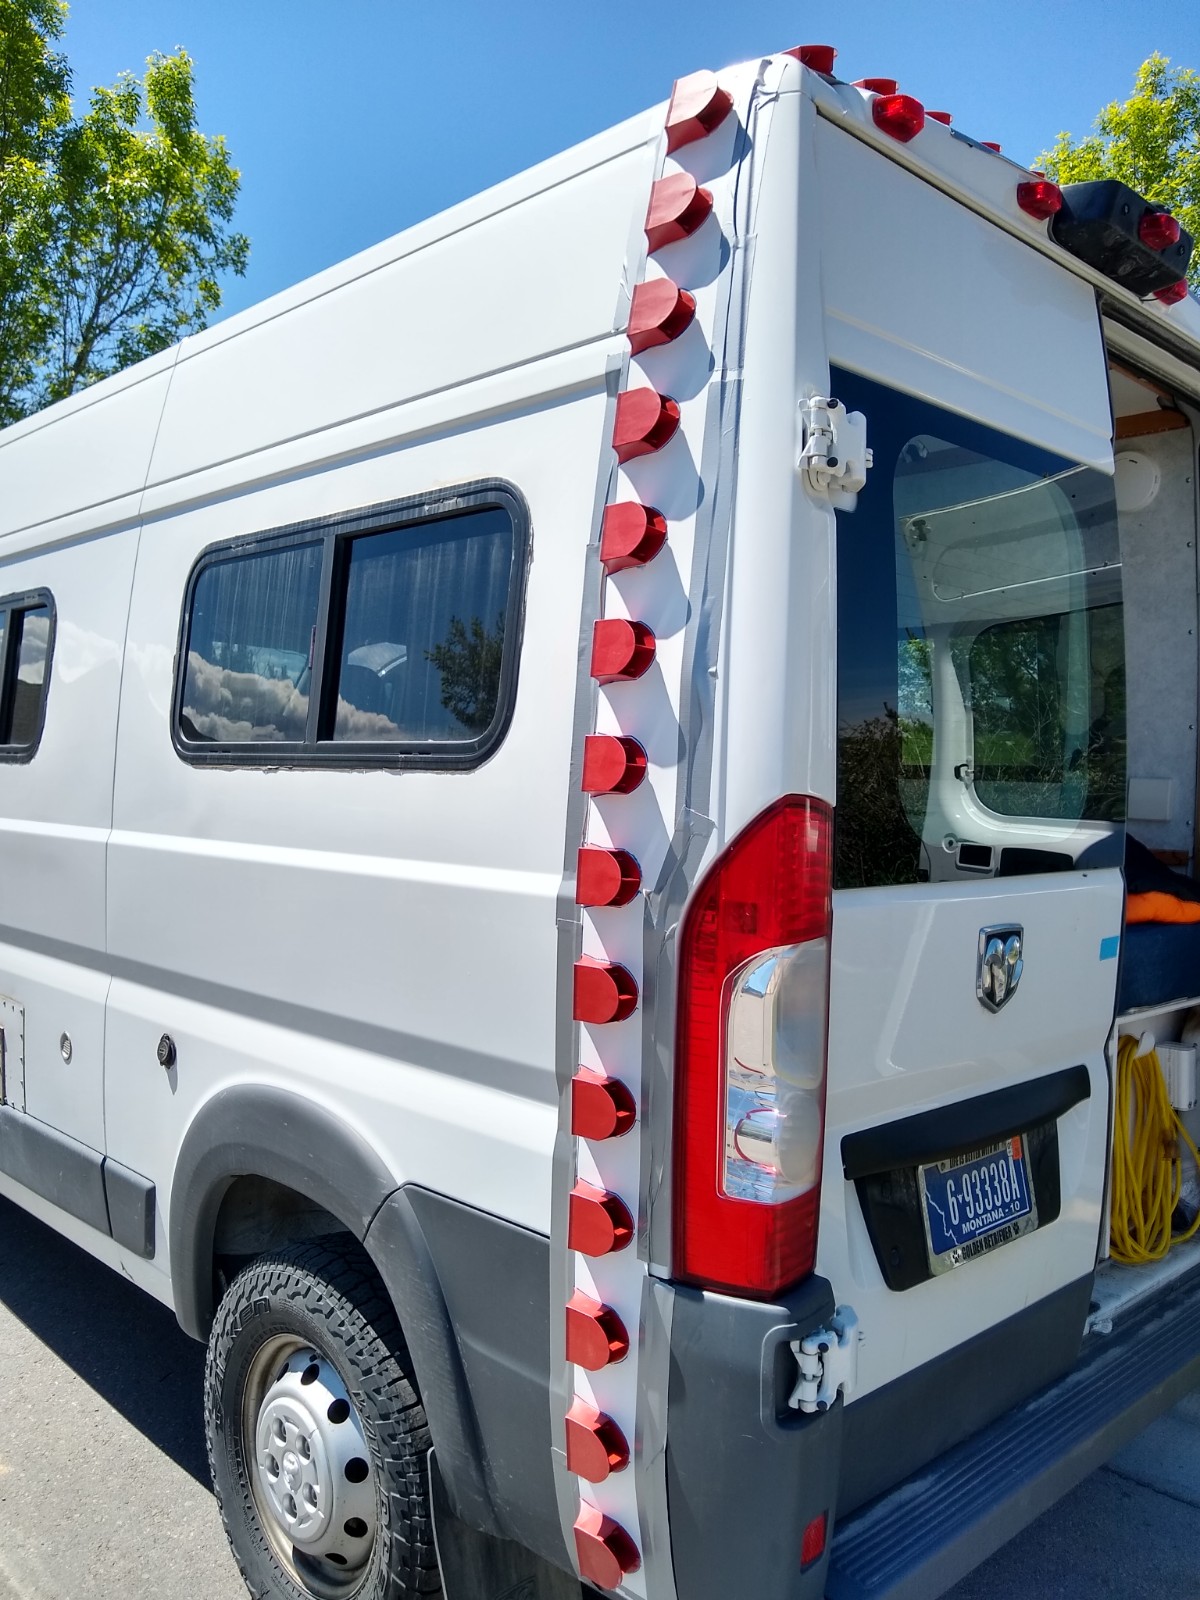
Vorbllades on each side of van.
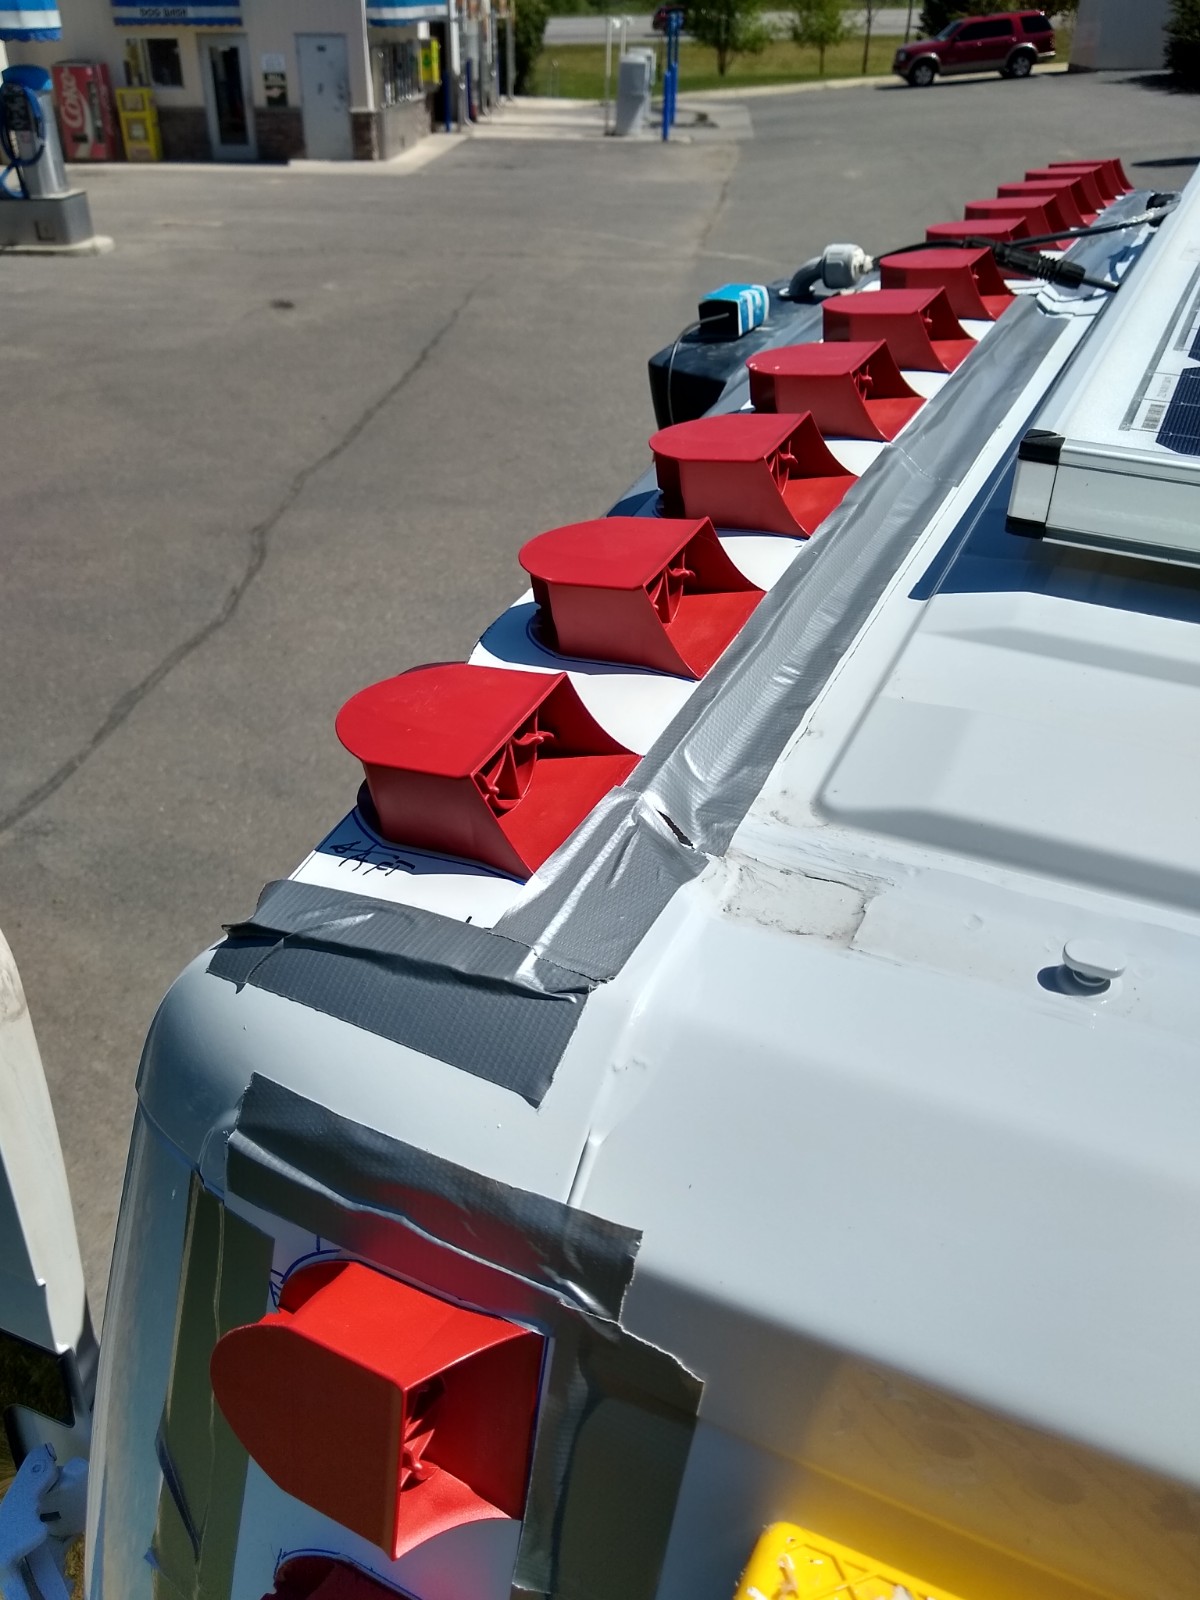
Vorblades on top of van.
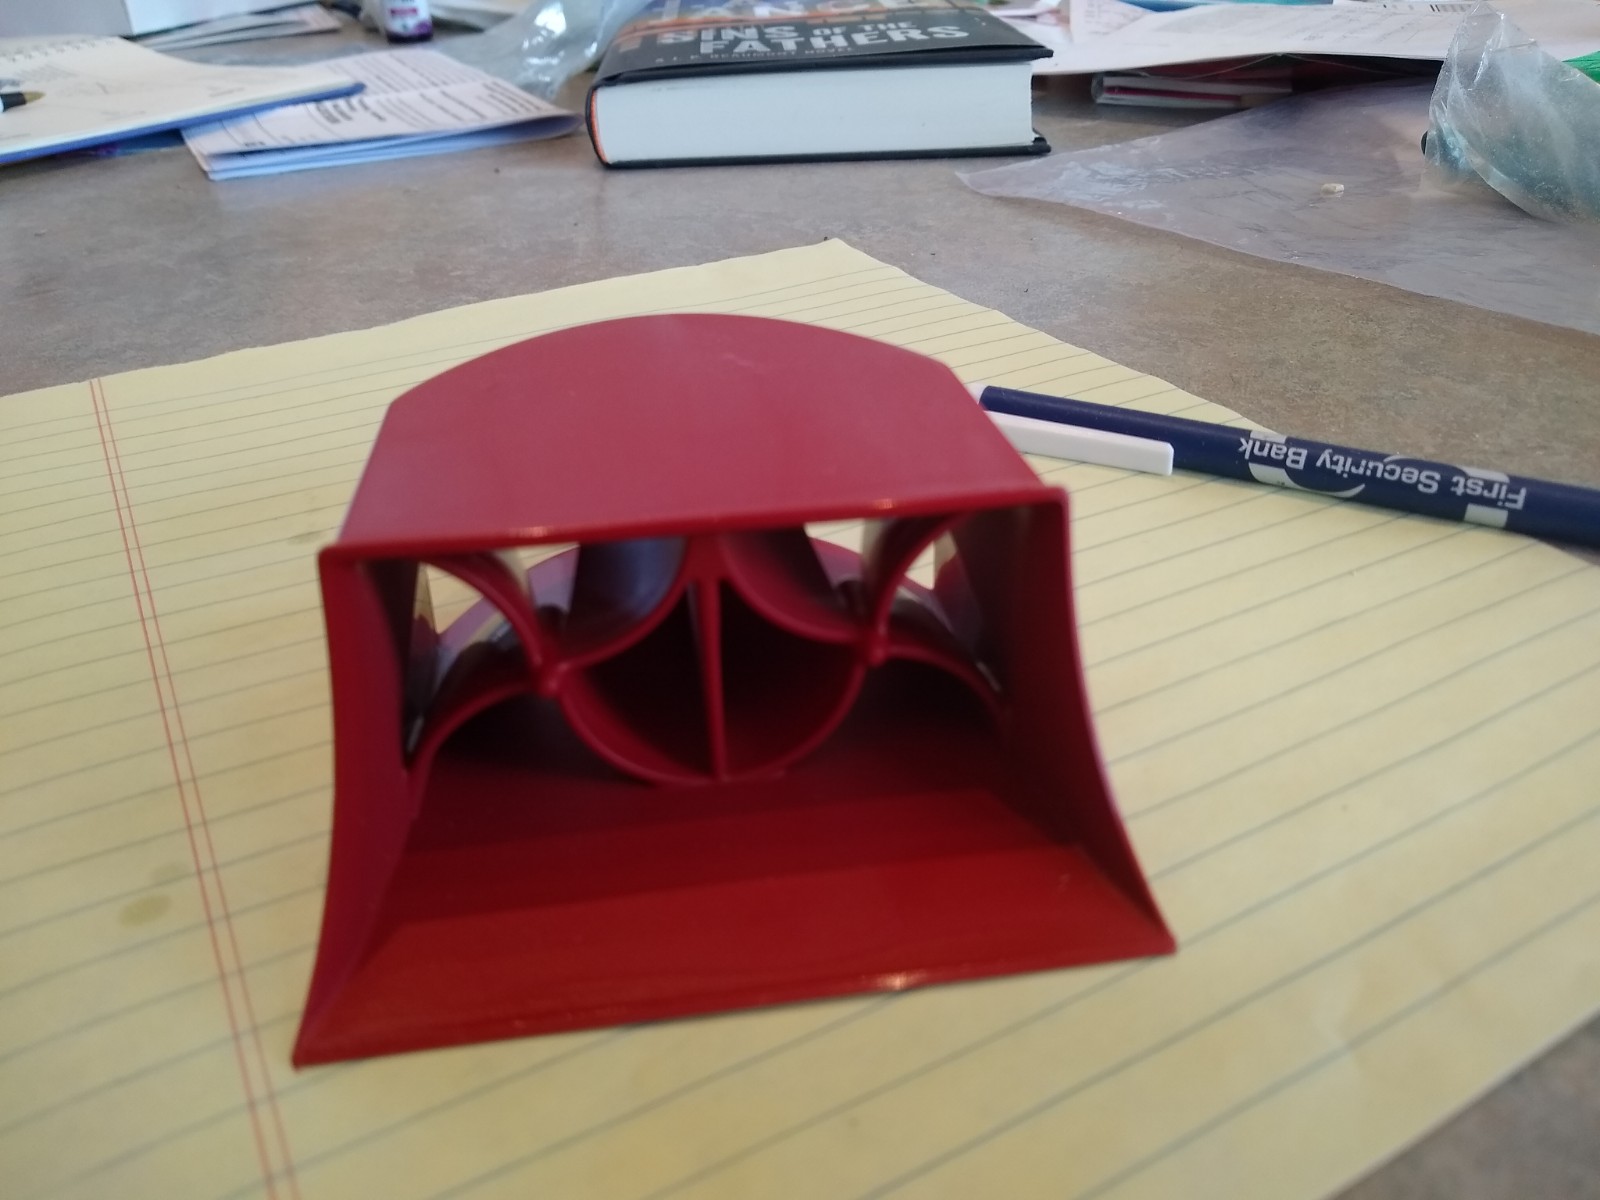
Closeup of one Vorblade vortex generator
I put them on alum sheet metal strips so that I could take them on and off easily for the testing and so that I would not have to keep them if they did not work.
Test Procedure:
The overall test was two 35 mile loops on I90 with no Vorblaes, followed by two 35 mile loops with Vorblades, followed by two more 35 mile loops without Vorblades. This is would be called an A-A-B-B-A-A test by the Ecomoders. The extra two A runs without VGs on the end are meant to catch MPG changes due to changing test conditions as the test progesses.
The loop started at the West bound entry ramp for I90 exit 305 (Bozeman, MT) then progressed 17 miles west to the exit 288 (Manhatten, MT), over the freeway and onto the eastbound entry to I90 at exit 288. The loop ends at the exit ramp for exit 306 33.6 miles later. Total distance 33.6 miles.
The PM trip A was reset on the 306 entry ramp, and was read on the 306 exit ramp 33.6 miles later. Tried to keep the reset places the same, tried to keep acceleration to cruise speed the same, set the cruise control to 65.9 mph (mostly never reset it), tried to stay clear of traffic and tried to avoid any tailgating of semis (which would improve mpg). The traffic and speed were such that I was able to avoid almost all speeding up or slowing down and tailgating.
I have a OBDlink MX OBD reader hooked to my Windows laptop with OBDWiz software and was able to display a digital readout of the speed to allow precise setting of the cruise control to 65.9 MPH for all runs.
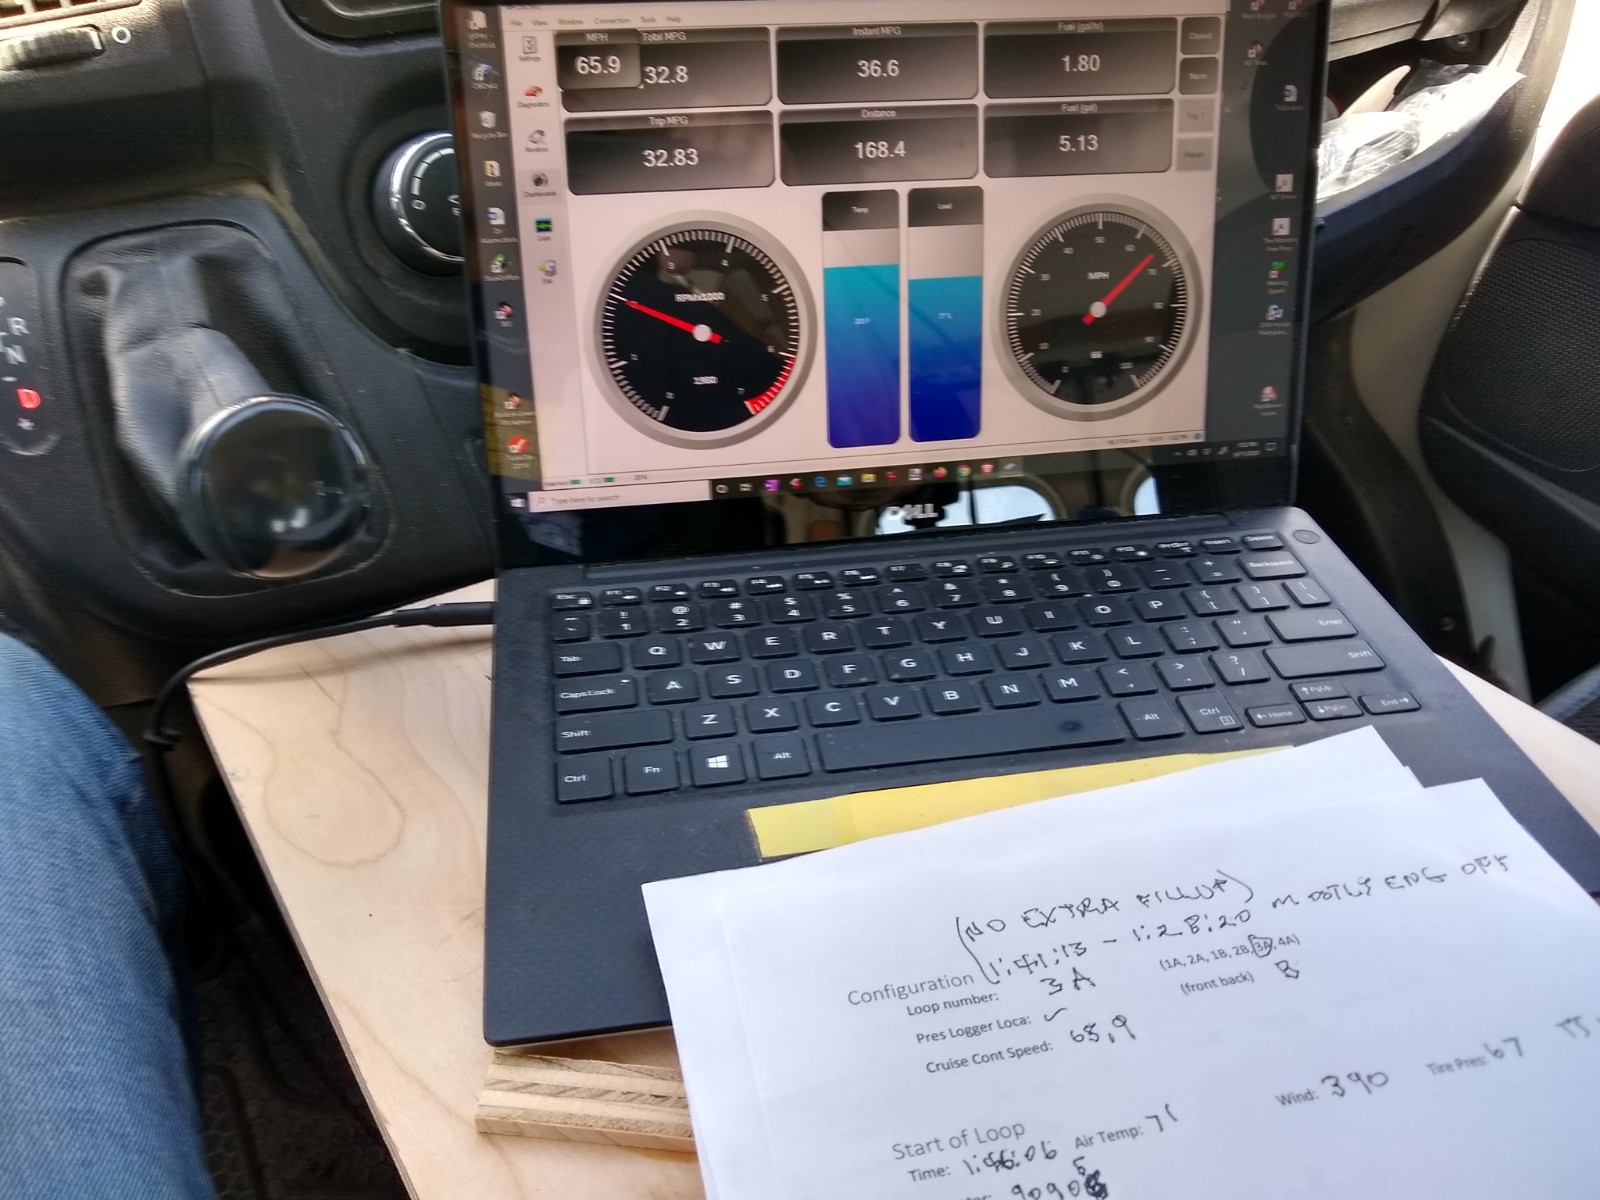
The OBDlink MX was also used to continuously log all the fuel/mpg/speed data for each run.
I started by warming up the vehicle and tire with of about 12 miles at 40 mph (house to freeway) plus 15 miles at 65 mph on the freeway. At the start of each run, I measured the tire temperature, and tire pressure of the front driver side tire. Also measured the wind velocity with a Kestrel wind meter. I did all of the runs with AC off, all windows closed and no changes to the van configuration. Started the first A run at 10:18 AM.
At the end of the first two A runs, I went to a very close by gas station and filled up using the procedure recommended by Winston – this is very tedious and requires about 2 minutes of fiddling to get the gas level to sit right at the filler neck with no retreating. I used the same pump for each fillup except for the last one which I was unable to get that pump.
I started each run by pulling off to the side on the entry ramp and taking the tire pres, tire temp and wind readings. Then accelerated down the ramp resetting trip A just as I started.
On the run, I noted the time from passing mile maker 296 and 292 (this is a nice and pretty level stretch) so I could look at this 4 miles on the PBD log later.
On reaching exit 288, I exited, crossed the freeway, pulled on to eastbound entry ramp and pulled off just long enough to record the mid trip A values, then accelerated and resumed cruise control to 65.9 MPH. On getting back to 306 and exiting, I pulled off to side of exit ramp and recorded the Trip A setting – did this at the same place each time.
After the first gas station fillup, I pulled into a close by parking lot and installed the Vorblades. Used duct tape to tape the full leading and trailing edges of the sheet metal that the Vorblades were attached to. Got my PBJ out of the fridge, had a quick pee and was on the way in about 15 minutes. Went back to the gas station and did a 0.276 gallon fillup in order to start the B runs with a full tank.
Did the two B runs (with Vorblades) in exactly the same way as described above. Then went in for the 2nd fillup and used the same pump. Went over to the parking lot and took off the Vorblades (5 minutes) and on then on the way for the las set of two A runs. I did not fill up after removing the Vorblades, so should probably take about 0.1 gallons off the final fillup.
Did the final set of two A runs in exactly the same way. The final fillup did not go to well. I could not get the same pump as a monster rig had just pulled into it. Picked another pump and unfortunately the nozzle on this pump was not easy to get low flow rates on. Spilled about a cup of fuel (0.03 gal) on the ground. So, I have less faith in this final fillup. It says 3.77 gal, but I think 3.64 would likely be closer and still subject to some doubt.
Finished at 3 PM.
Results:
The PM trip computer is not ideal for making exact MPG estimates. It does not directly use fuel injector data to estimate fuel use, but instead calculates fuel use from air mass flow rate (which I believe it does not directly measure, but estimates from manifold pressure). This is true of a lot of vehicles these days and is (maybe) not as bad as it sounds in that the computer is constantly adjusting engine parameters to keep the fuel air mixture at the target it has set – so, mass airflow should give a pretty good estimate of fuel use rate.
So the trip computer is not ideal, but it is easy to use, does not require buying any new gadgets, and when you are only looking for differences (with and without VGs) and not absolute MPG, I think it works pretty well. The actual gas fillups are an independent check on the trip computer and do agree well.
This plot shows the MPG readings for all 6 runs. The first two are without VGs, second two are with VGs, and final two are without VGs. I’m an optimist, but I just can’t see any evidence of a gain in MPG for the Vorblades.
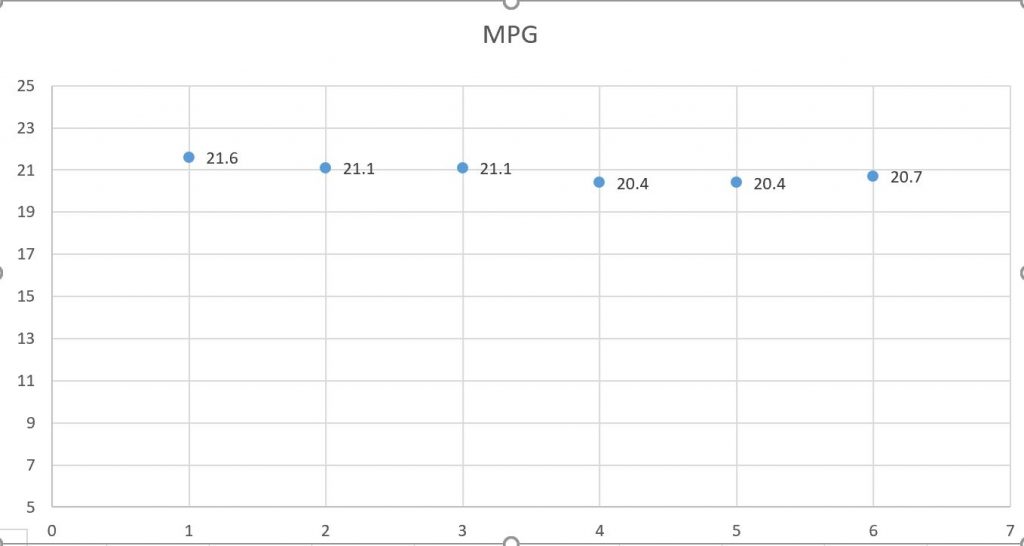 The two left points are the first two runs (1A and 2A) without VGs, middle two points are the two runs (1B and 2B) with VGs, and right two points are the final two runs (3A and 4A) without VGs.
Gas fillup after the first two runs without VGs was of 19.9 MPG.
Gas fillup after the 2nd two runs with VGs was 19.9 MPG.
Gas fillup after last two runs without VGs was 18.7 MPG, but this fillup had some problems.
OBDlink Logs:
The OBDLink method of MPG calculation uses Manifold pressure to estimate mass airflow which is in turn used to estimate fuel flow – they can only work with the parameters that Chrysler provides. Apparently the engine volumetric efficiency and the Brake Specific Fuel Consumption (lb/hp*hr) are involved in the calculation as they allow you to enter these two parmeters. Since I have no idea what these are, I just used the defaults, this resulted in MPGs that were very low (like 10 MPG when it should have been about 20 MPG).
As you are driving, the software can display a variety of things – like speed, mpg, coolant temp, etc. Of these, the most useful was the speed displayed as a digital indicator, which helped a lot when the cruise control had to be reset.
The software will also log parameters of your choice at about 0.3 second intervals. Even with the MPG being way off, these are interesting to look at as you can see how much things change as you drive the loop. In general the values were very steady and slow changing over flat parts of the road.
OBDLink displaying on Windows laptop.
Tufts and Pressure:
Just for the heck of it, I also installed yarn tufts on the back window and videoed them during the test with and without the VGs. The idea being that if the VGs worked, they might change the flow pattern over the back of the van. I’ve looked at the videos, and both show quite a bit of tuft movement indicating separated flow. There is an average movement of the tufts from center toward the outside edge of the van with and without VGs. This outboard flow shows up driving both east and west, so it is strong enough to overcome the light crosswinds of the day. If anyone is interested in seeing the videos, I can probably send them up to Youtube.
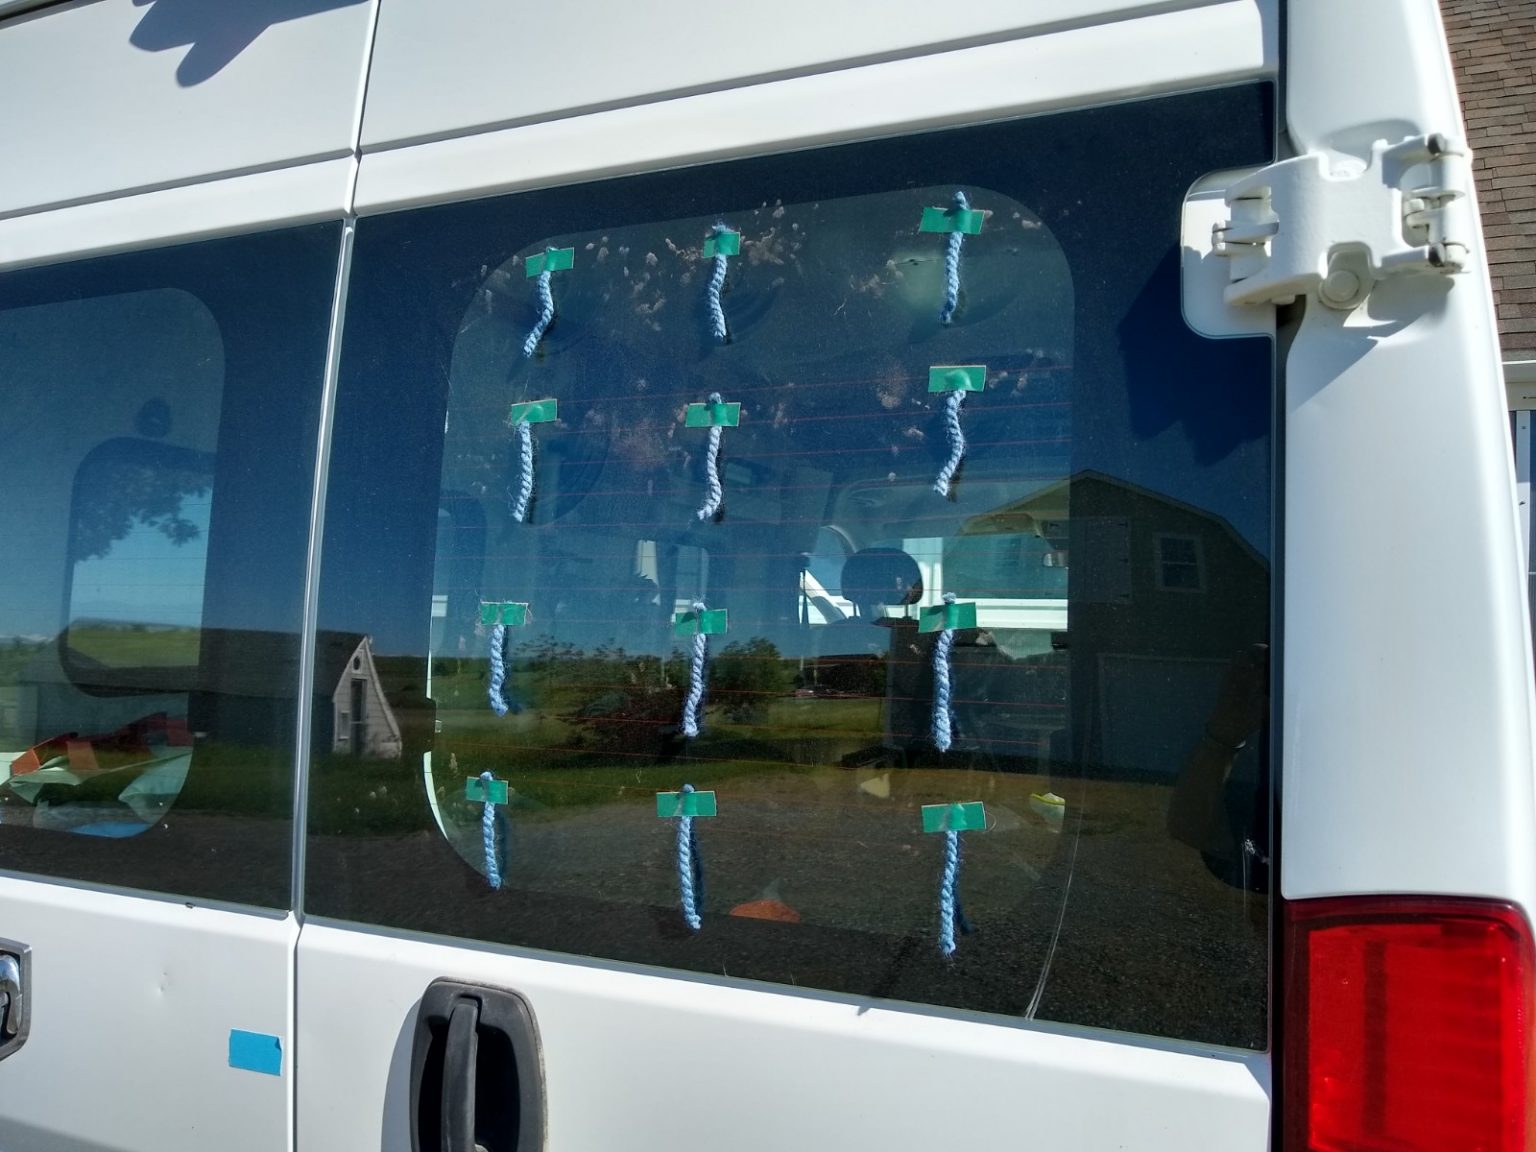
Yarn tufts installed on back window.
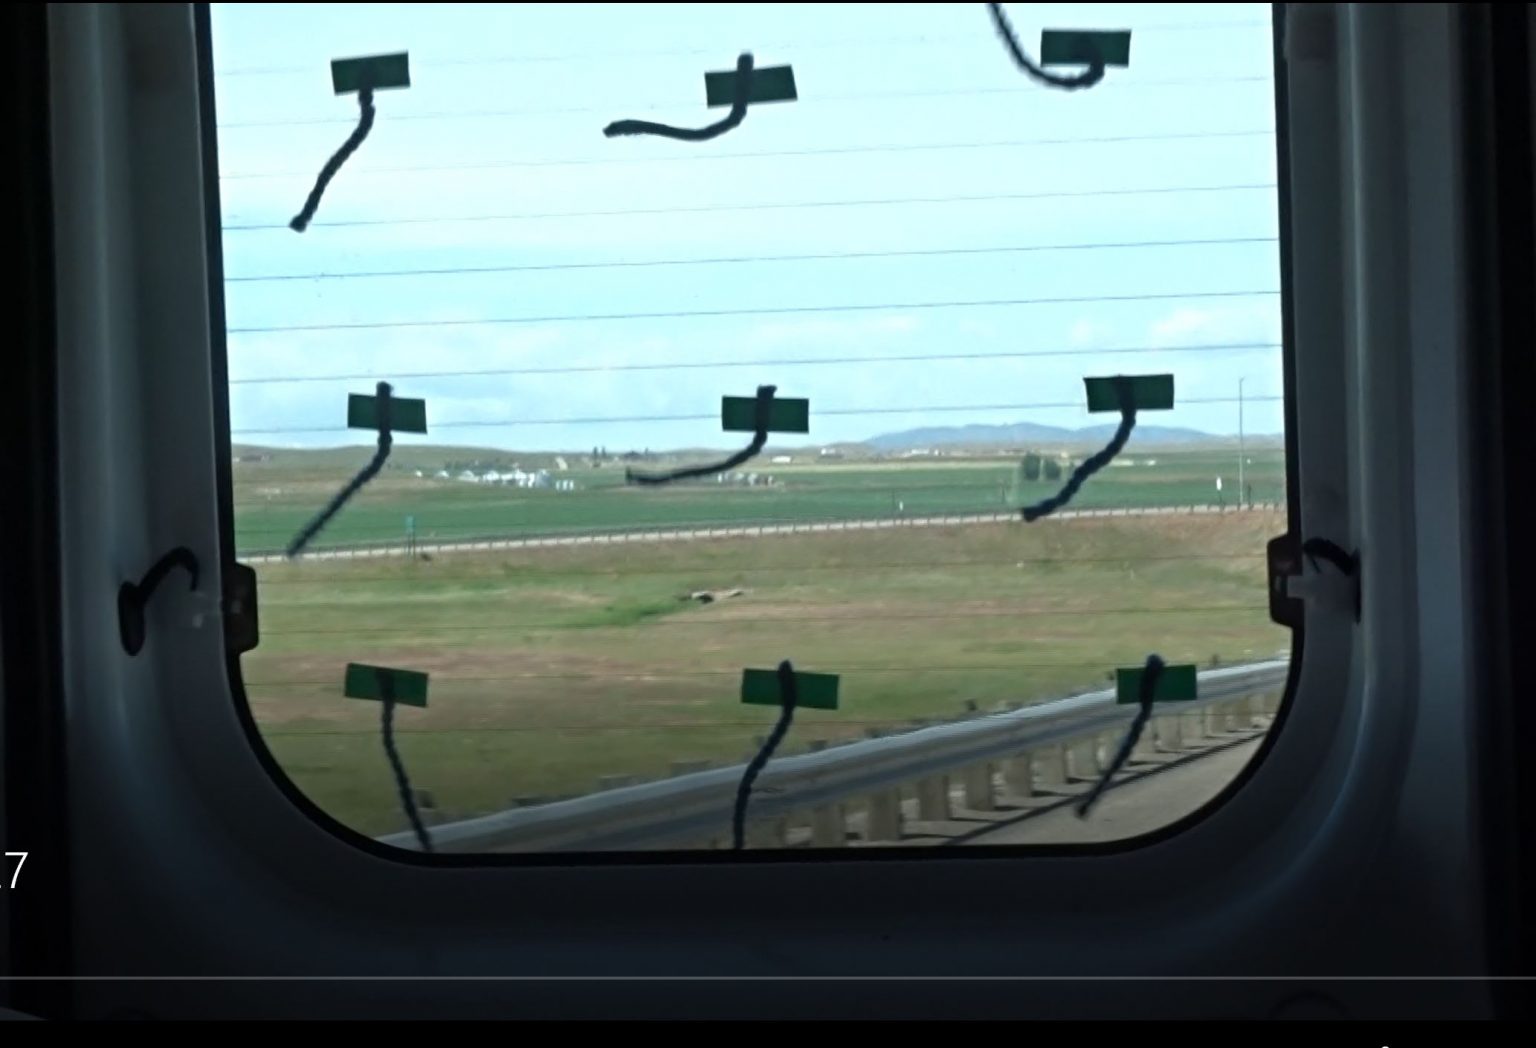
Still from video of tufts during drive. Quite a bit of eratic movement, but some indication of flow from center to outside.
Also, just for the heck of it, I used this little pressure logger to log pressure at the center of the rear van doors (also got readings at the front of van). The idea was to see what the low pressure (high drag) area at the back of the van was, and to see if the VGs did anything to reduce the depth of the low pressure area. The plots are kind of interesting to look at, but are not really precise enough to draw conclusions from (at least for me). One interesting think is that (apparently) the barometric pressure changed enough over the 17 mile width of the loop that it is the biggest change you see on the plots – who knew?
The little pressure logger installed on front of PM – also did a runs with it installed on back.
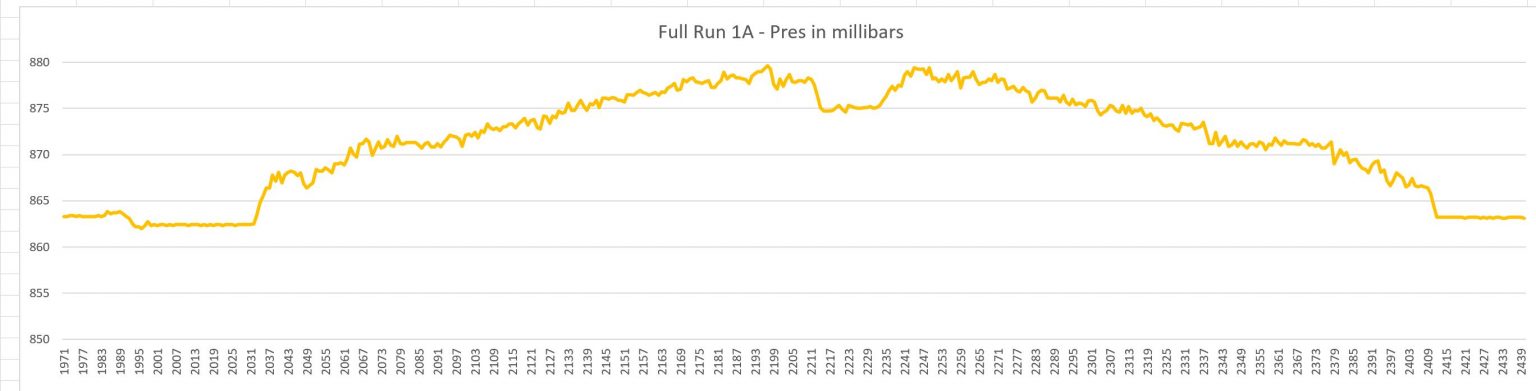
Plot of pressure logger for one full loop. The drop at the center was the stop at exit 288 (middle or run) and its depth shows the ram air pressure on the front of van. About 5 millibars or about 10 lbs/sqft. The difference in pressure between the flat at start and flat in the middle is apparently the difference in barometric pressure between the two locations (17 miles apart).
Alternate Procedure:
After spending most of a day doing this test I’m thinking that most people are not going to want to devote this much time an effort, and it would be nice if we had a simple procedure that people with a bit of interest could do easily. So, here is a cut at such a procedure… Feedback on this would be appreciated.
Pick a nice day with low and stable winds.
Warmup the van and tires before starting the first run. Don’t change settings like AC or windows during the test.
Identify a relatively flat stretch of freeway that has no have traffic complications (like exits) and that you think you can drive consistently several times. Note start and end mile markers for this chosen stretch. Try to pick this test stretch such that there is an exit you can start at and U-turn at on each end without driving too far. Get on at your starting exit. Set the Cruise control to desired MPH (try not to change it for the entire rest of the test – just use cancel and resume as needed). As you pass the start of the test section mile marker, press the reset Trip A. With the display on Avg MPG, note the trip MPG just as you pass the end mile marker and record it. At the end of loop exit, cross the freeway and get back on going back the way you came. Resume your cruise control setting. When you reach the first of the mile markers going back, do a reset Trip A, and just as you pass the 2nd mile marker, note the average trip MPG and write it down. Repeat the whole loop once more. Make the change you want to measure to the van, and do two more loops the same way. Ideally, undo the change to the van and do two more loops – so, you are doing an A-A-B-B-A-A test. Depending on how consistent the readings are for this method, maybe and A-B-A would be OK? Even just an A-B test might be useful under some circumstances?
At end of test, compare the MPGs your wrote down to see the effect of the change you made. How consistent the A runs are would also give you an idea how much confidence to have in the result.
I’m not sure how long the test stretch should be. I think one mile is too short because of timing uncertainty in the reset Trip A and trip computer update frequency. I think something like 3 miles might be good, but maybe 5 miles would be even better? Judging by the steadiness of the OBDLink log data, I don’t think it needs to be more than 3 to 5 miles.
I think its helpful to have something that displays speed digitally in order to be able to consistently set the cruise control. It might be possible to set the cruise control at the start of the test and never reset it and this should be possible on the PM, but I found that I could not get it to work over the whole test and had to reset a couple times during the test – having a digital speed readout makes it possible to reset it exactly. Most of the OBD readers offer a digital speed readout on your phone.
I like this method because it eliminates the end of loop inconsistencies (like harder acceleration on one run than another), it would not take as much time to do the test and it does not take any special equipment, and it shortens the whole test time which makes it less likely that conditions (like wind) will change during the test, and I think its likely to be pretty accurate. If I look at the log data from my OBD logger, and pick a nice consistent flat section, the reading from log point to log point change very slowing with many repeats at exactly the same values.
If you have a good section of two lane highway, the same procedure could be used just using fixed objects along the road instead of mile markers – this would make the whole thing simpler and quicker if you can find a good stretch of two lane highway.
There are, of course, changes to the van that you can’t make in 15 minutes in a parking lot in the middle of the test, so the A loops and B loops would have to be on different days. This may still work if the days are similar and you have not mixed in other changes to the van that would effect MPG, and you set the tire pressures the same each time. This could easily be tested by just making some A runs on different days and seeing how close the readings come out.
Detailed Loop Data:
Loop 1A – no VGs:
Time: 10:18:38 AM to 10:51:22
Air temp: 54F, Wind: 4 mph
Tire Pres: 65 psi, Tire Temp: did not get
Cruise Cont: 65.9 MPH
Mid Point MPG: 24.0
End MPG: 21.6 Dist: 33.6 mi
Fillup: None
Loop 2A – no VGs:
Time: 10:58:50AM to 11:33 AM
Air temp: 54F, Wind: 2 mph
Tire Pres: 67.5 psi, Tire Temp: 109F
Cruise Cont: 65.9 MPH
Mid Point MPG: 22.6
End MPG: 21.1 Dist: 33.6 mi
Fillup: 3.42 gal (19.9 MPG over 68.2 miles incl drive to gas station)
Loop 1B – with VGs:
Time: ?? to 12:46:08 PM
Air temp: 55F, Wind: 3.3 mph
Tire Pres: 68 psi, Tire Temp: ?F
Cruise Cont: 65.9 MPH
Mid Point MPG: 24.0
End MPG: 21.1 Dist: 33.6 mi
Fillup: none
Loop 2B – with VGs:
Time: ? to 1:24:20 PM
Air temp: 68F, Wind: 4.6 mph
Tire Pres: 68 psi, Tire Temp: 118F
Cruise Cont: 65.9 MPH
Mid Point MPG: 23.0
End MPG: 20.4 Dist: 33.5 mi
Fillup: 3.44 gal (19.9 MPG over 68.2 miles)
Loop 3A – no VGs:
Time: 1:41:13 PM to 2:19:02 PM
Air temp: 71F, Wind: 4.4 mph
Tire Pres: 67 psi, Tire Temp: 117F
Cruise Cont: 65.9 MPH
Mid Point MPG: 22.8
End MPG: 20.4 Dist: 33.6 mi
Fillup: none
Loop 4A – no VGs:
Time: 2:23:15 PM to 2:56:05 PM
Air temp: 81F, Wind: 5.7 mph
Tire Pres: 69 psi, Tire Temp: 130F
Cruise Cont: 65.9 MPH
Mid Point MPG: 22.8
End MPG: 20. Dist: 33.5 mi
Fillup: 3.64 gal – corrected — (18.7MPG over 68.2 miles) – this fillup questionable
Wow – this was a long one — congratulations if you got all the way to the end!
Gary
June 15, 2020
Hi Gary,
I have wondered about the vorblades on something smaller than a semi. I’ve done aero mods and increased the mpg of my pickup by 50% on average, driving 500 miles from Salt Lake City to Belt, MT; dropping from 3 (to 4.5 depending on weather) tanks of gas to two tanks regardless of weather. Part of the aero solutions I used were airtabs, and they have done a lot for stabilization in cross winds- but also for connective airflow further forward on the vehicle. https://dangerhart.wordpress.com/2021/02/04/todays-concept-connective-airflow/ , as well as https://dangerhart.wordpress.com/2022/07/19/aeronerd-update/
Possibly some forward aritabs to clean and connect airflow would activate the vorblades further. That, and both the tabs and blades work best at 70-80mph.
The size of the vorblade creates a drag co-efficient that just may not be recovered by a vehicle smaller than a semi. I have thought of using them to create a rear wing affixed to a single bar of my shell rack, it would come down to the drag v benefit.
Hi Dan,
Interesting stuff.
If you want to experiment with Vorblades, I can send you some.
Let me know: BuildAGreenRV@gmail.com
Gary
Hi Tim,
If you want to try the Vorblades, I still have them and could ship them to you. My email is here: https://www.buildagreenrv.com/contact-gary/
But, I suspect you are correct the on affect they would have.
That’s an interesting idea on the fins.
I do plan to do some more aero testing and was thinking trying something like the “Truck Tail” fins made from scrap plywood. As you say, the back doors might figure into that plan.
Gary
Gary, Thanks for the details. I was looking into Vorblades myself and was not quite sure of their claims, but your real world test makes it more clear. One thing I noticed, which may be the difference between your van not performing any better and a tractor/trailer that might, is that your van has lots of turbulent areas before getting to the blades. My trailer is not smooth either – A/C on top, awning on the side, so I would expect a similar result as you. Tractor/trailers, on the other hand, are usually unobstructed allowing air to cleanly go through the blades. They are also longer allowing more area for any air pushed up at the front and causing turbulence to reconnect with the trailer before hitting the blades.
I wonder if fins in the back would work. You could actually simulate that using your back doors.
Hi Tim,
If you want to try the Vorblades, I still have them and could ship them to you. My email is here: https://www.buildagreenrv.com/contact-gary/
But, I suspect you are correct the on affect they would have.
That’s an interesting idea on the fins.
I do plan to do some more aero testing and was thinking trying something like the “Truck Tail” fins made from scrap plywood. As you say, the back doors might figure into that plan.
Gary
Gary,
Thanks for the offer, but I’ve already winterized my trailer, so it won’t go out until May or so. I think, based on your research and others I’ve read, I will opt for a cap that slopes up towards the back when pulling the trailer. Hopefully this will still allow room for the ATV but also direct the wind around the trailer more. I know some would say why waste the money since you’ll never make up the money on the gas saved, but for me it would be nice to be able to go rather on a tank of gas and not have to stop so often. If I feel really energetic I may put a belly pan under the truck to smooth out the turbulence from underneath.
I’ll be interested in you “Fin” test, when you get around to it. That is something I think would work for my trailer.
Sounds good – please keep us posted.
Gary