Important note…
After looking at the data carefully, I’ve come to believe that the data developed in this test is not reliable. I think that the flow produced by the blower is probably just not uniform enough to give good results.
I’m leaving the page here just for information on how not to test PV panel fairing drag 🙂
I’m working on a wind tunnel to get better data…
IOn the ProMaster and Transit van forums, there has been a bit of discussion on whether adding fairings to smooth the airflow over roof mounted solar PV panels would decrease drag and save some fuel and carbon emissions. The test below is a very rough cut at trying to answer this question.
Setup
The fairings tested include a bullnose fairing for the front of the panel that is shaped like of a half ellipse, and a boattail fairing on the rear of the panel with a 14 degree closure angle. Most of the drag associated with a PV panel occurs at the blunt front of the panel where airflow separation can occur and at the blunt rear of the panel where air flow separation and an associated low pressure area increase drag. The added fairing attempt to provide smooth, non- separated flow over the full panel.
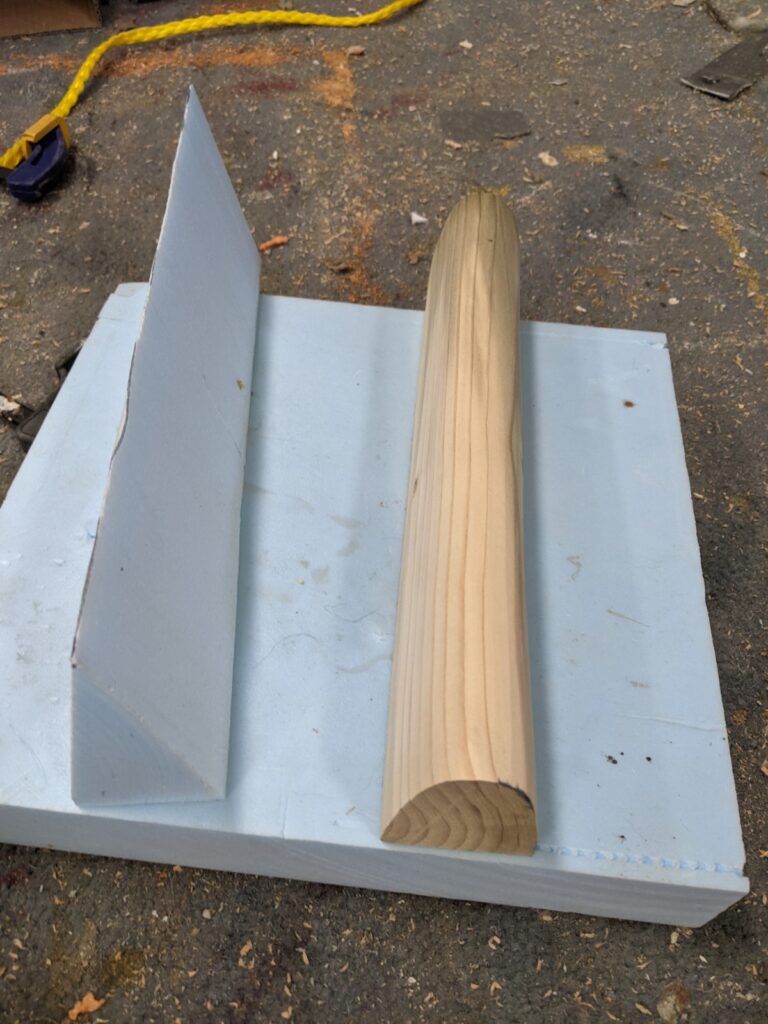
The trailing edge fairing is just a triangle with a closure angle of 14 degrees. It is 2 inches thick at the base and 4 inches long. The leading edge fairing is a half ellipse with a minor axis of 2 inches and a major axis of 5 inches.
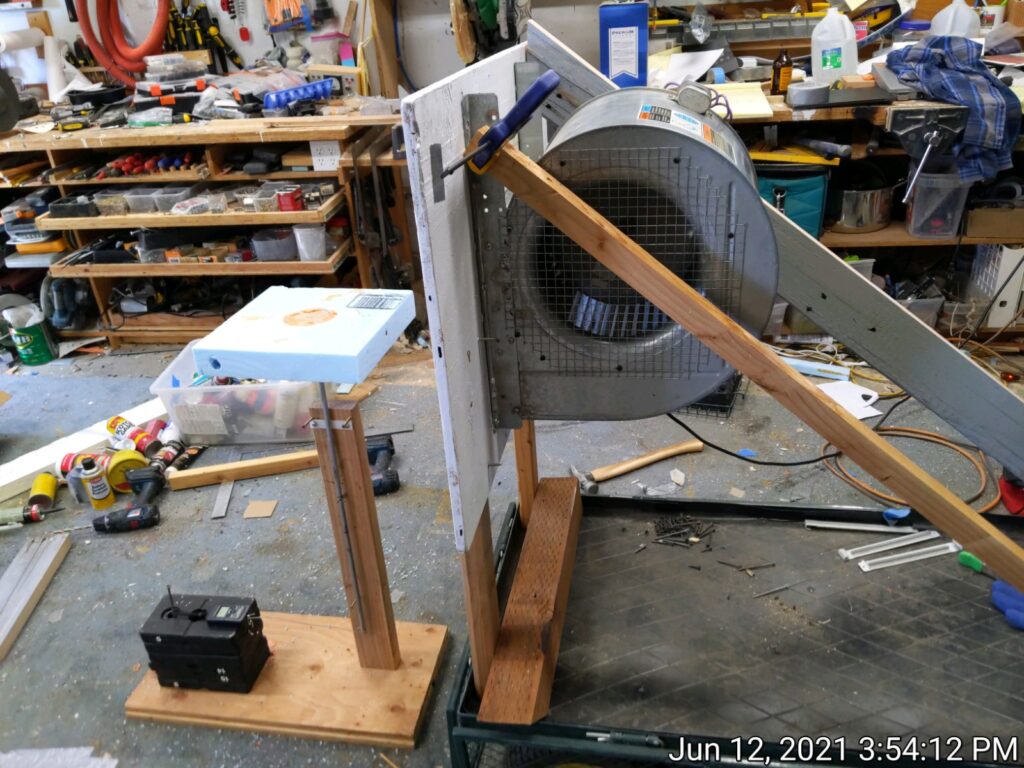
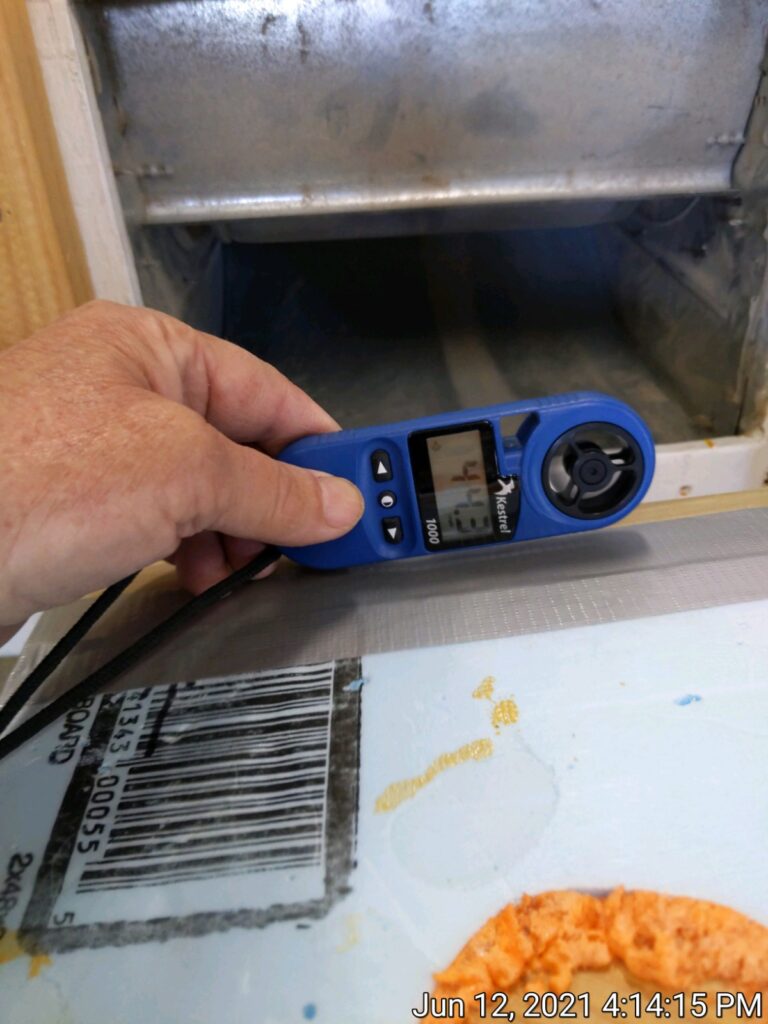
My first thought for testing was to make the fairings for the PV panel on my van and do a before and after MPG test like this one I did for roof racks. But, I did not think the difference would be large enough to measure reliably. Next throught was to mount the fairings on a small (say 12 by 12 inch) panel and hold this outside the van window while driving and measuring the force on it – sounded like fun, but maybe hard to get it all working. Next thought was to mount it stationary in the shop with a leaf blower providing the airflow. This was quick and easy and did provide some fairly good data, but the leaf blower airflow was very narrow, turbulent and variable. Then I remembered that I had a furnace blower that was modified to work as a blower door for house air leakage tests. I ended up using this for the test. It provides a 46 mph airflow over a much wider and taller area than the leaf blower and the airflow is less turbulent and variable. The drag readings are very stable and repeatable. It is definitely not as good as an actual wind tunnel would be because of the turbulence in the airstream and the velocity variation, but it seems to do a good enough job to get some useful data. It provides almost 3000 cfm at about 46 MPH.
The PV panel is simulated with a 12 inch by 12 inch by 2 inches thick piece of XPS insulation. When installed, the fairings are taped and pinned to the XPS. The XPS slab is supported by a 3/8 inch aluminum rod about 30 inches long that is pivoted in the middle. The bottom of the rod is attached via a wire link to digital a fish scale that reads down to 0.01 lbs.
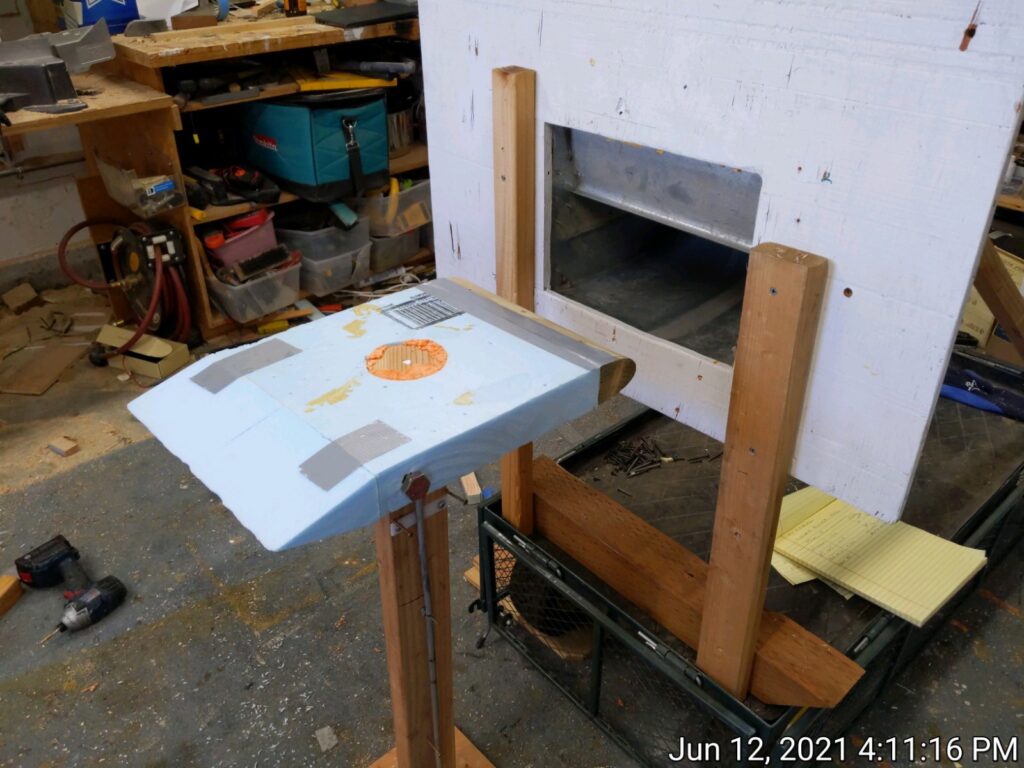
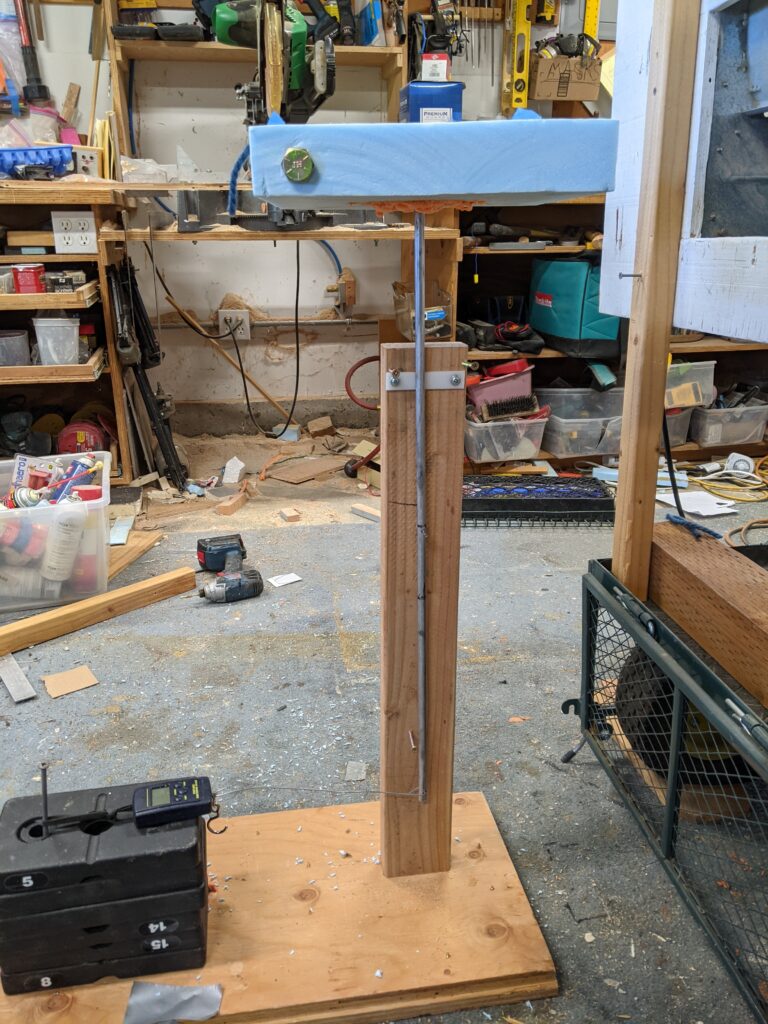
The bullnose fairing adds quite a bit of weight to the nose, so to keep things balanced I add some weight near the trailing edge so that the CG of the simulated panel is right above the pivot – this prevents it from adding anything to the scale reading as it tips.
Results
This setup is crude and cannot measure the drag forces on the simulated PV panel with the accuracy that a good wind tunnel would provide. The air coming from the furnace blower has a fair bit of turbulence, and the velocity is higher toward the center than at the edges. In addition, the velocity at the trailing edge of the panel is down about 12% due to the airflow spreading out. None the less, the panel is subjected to a high speed stream of air, and the measured drag forces are stable and repeatable, and they do agree well with what one might expect based on analysis. I think that in spite of the crudeness of the rig, it does provide some good guidance on what adding these fairings might do for you.
The air velocity at the center leading edge of the simulated panel 46 MPH and it drops off to about 31 MPH at the left and right edges of the panel. The air velocity also drops off from the leading edge of the panel to trailing edge by about 12%.
| Fairing Type | Drag Force lbs | % Change in Drag |
| No Fairing | 0.94 | base |
| Trailing Edge Only | 0.79 | -16% |
| Leading Edge Only | 0.32 | -66% |
| Both Leading and Trailing edge | 0.21 | -78% |
The reductions are substantial. An almost 80% reduction with both fairings in place. I am definitely going to put both fairings on the PV panel on my van.
I believe that it is likely that the trailing edge boat tail fairing would do better if we did not have the about 12% drop off in velocity from the leading edge to the trailing edge.
Tufts To Visualize Flow
I added yarn tufts along the panel to see if they would show where the flow was separated.
The first video with no fairings shows turbulent separated flow over the whole panel. The flow on the tuft at the leading edge indicates very odd, maybe even reversed flow.
The 2nd video shows the flow with both fairings in place. It appears to be smooth and attached over almost all of the panel, although there appears to be some separation right at the end of the boat tail fairing – perhaps a shallower closure angle would fix this?
How Much Difference Does it Make On Van Drag?
So, the fairings cut down the drag of the PV panel quite a bit, but does it make any difference in the overall drag and MPG of the van?
The fairings reduce the drag on the simulated PV panel from 0.94 lbs to 0.2 lbs (almost 80% reduction). This is with 12 inches of PV panel width, 46 MPH in the center and 30 MPH on the edges. Scaling these up to the full van with 60 inches of panel edge facing the airflow, and cruising at 70 MPH, the drag goes up to about 15 lbs with no fairings and 3 lbs with both fairings. The net decrease in drag for the fairings works out about 12 lbs. A very rough calculation of drag for the full van at 70 MPH and a drag coefficient of 0.33 is about 200 lbs. So, the reduction in drag is about 6%. If we take the common assumption that about 70% van gasoline at highway speeds goes to overcoming aero drag, then the MPG increase for the fairings would be about 4%, or about 0.8 MPG. Over 200K mile van life and with $3 per gallon gasoline, this is 472 gallons, $1420, and about 9,250 lbs of CO2.
This is a VERY rough calculation – it could easily be off by a factor two. But, it does indicate that for just a little bit of effort to make and install the fairings, you might get a pretty good payoff.
Another thing to bear in mind is that if you want to minimize the MPG penalty for solar, don’t mount the PV panels on one of those massive racks that covers most of the roof — the rack will end up having a lot more drag than the PV panels.
Gary June 2021